Welcome to
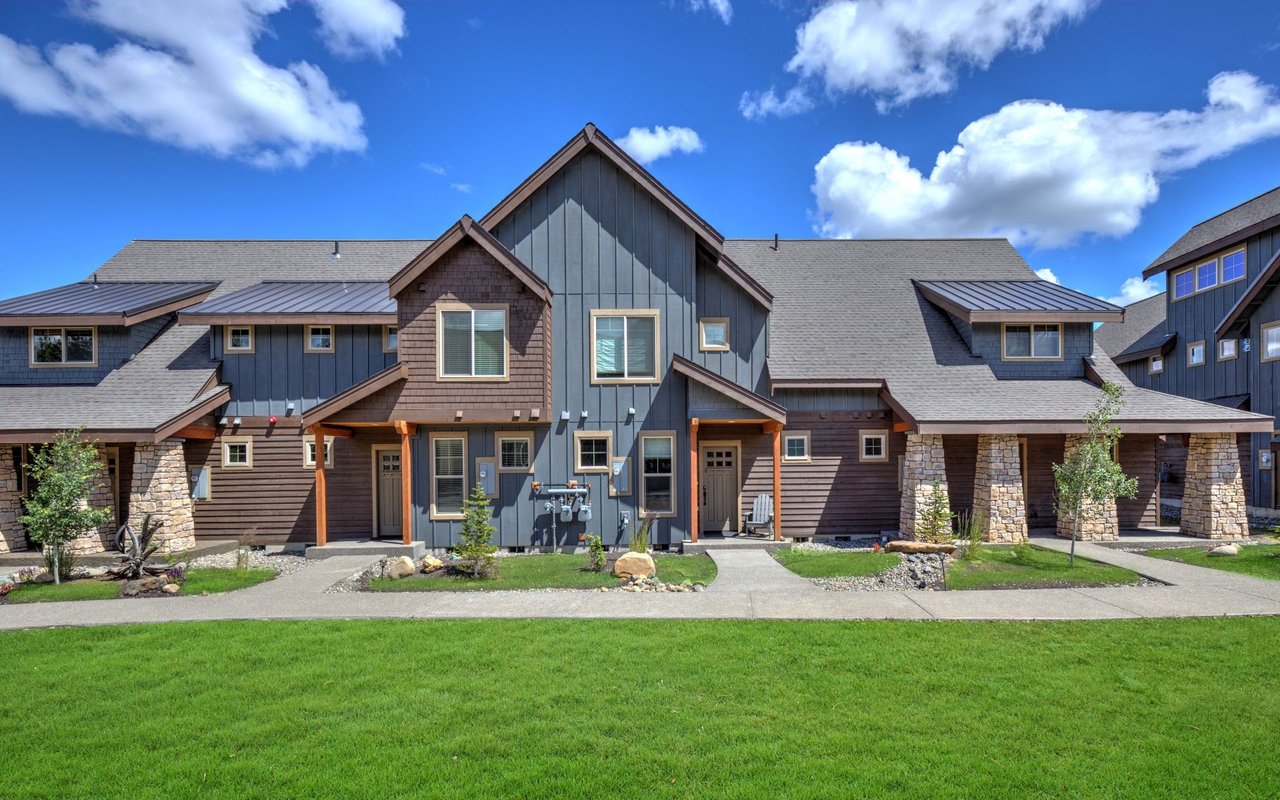
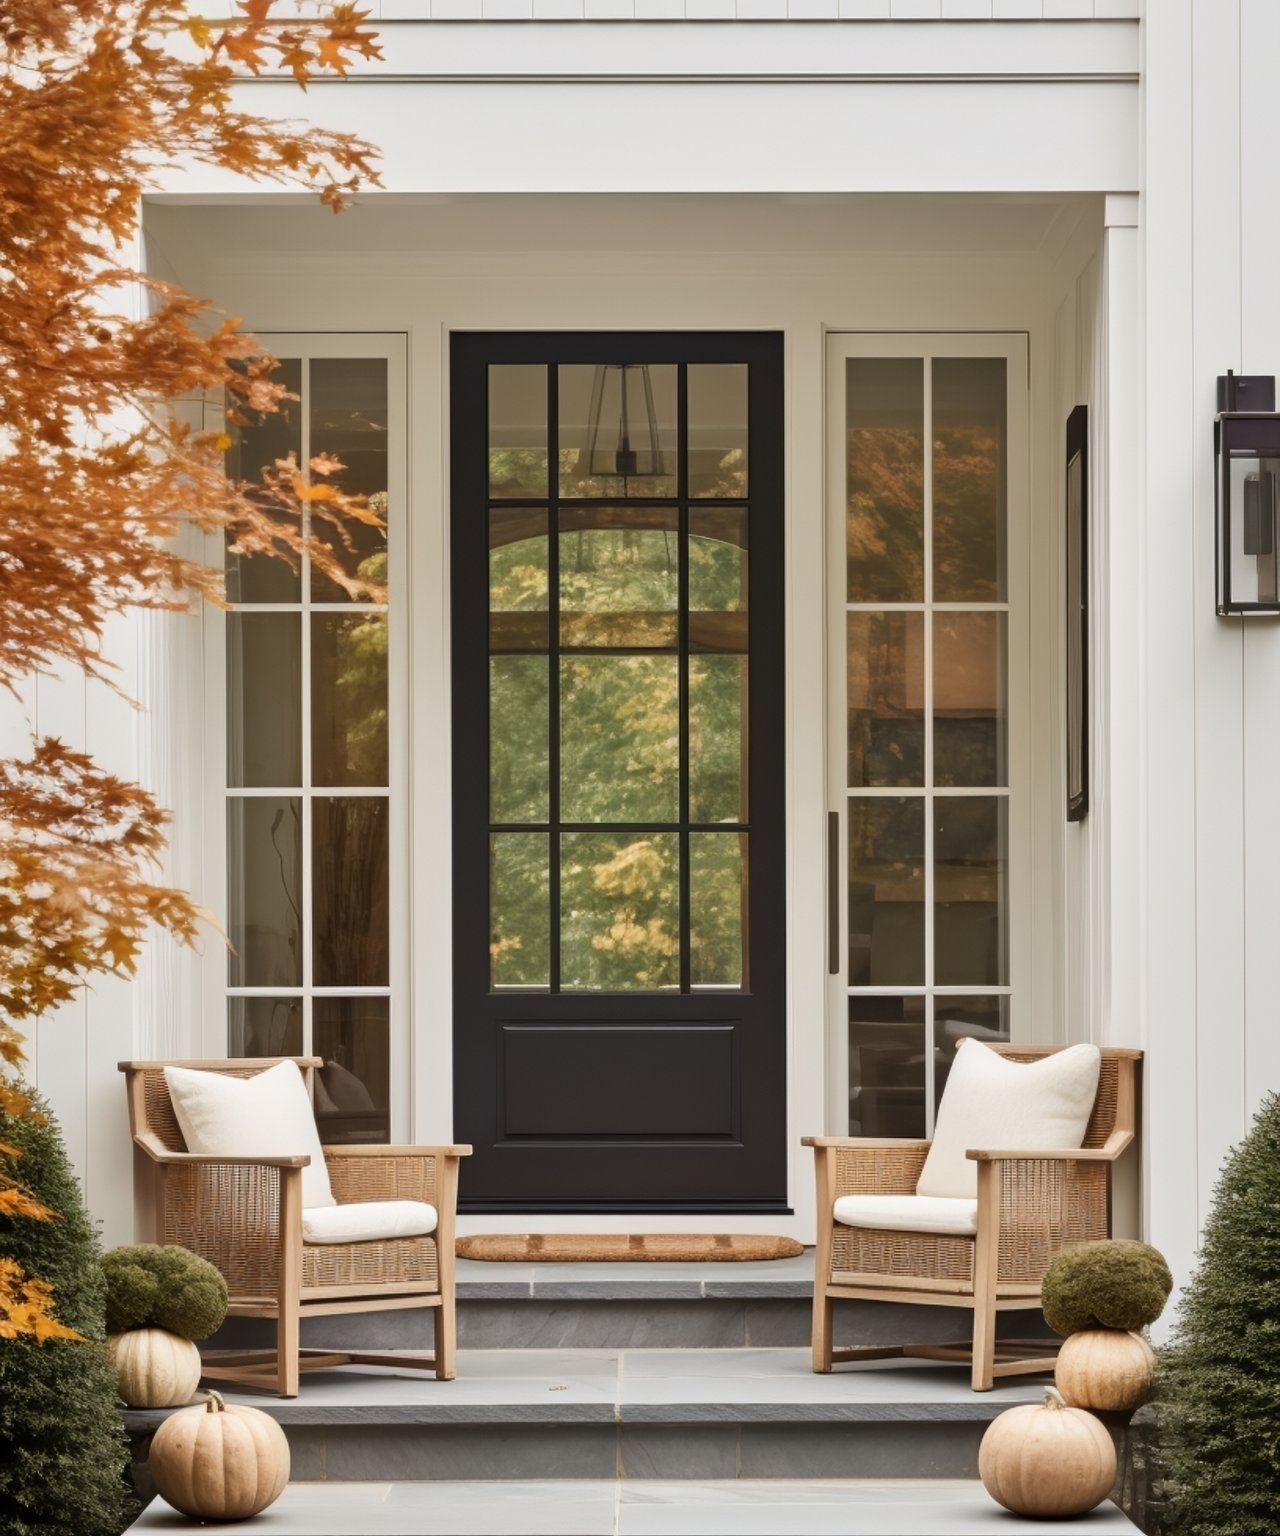
Welcome to Graystone, one of Bixby’s most desirable neighborhoods, a place where elegance, space, and community come together. Tucked among mature trees and wide, peaceful streets, Graystone offers the perfect balance of luxury living and small-town warmth. Homes here are thoughtfully designed, with beautiful architecture, spacious lots, and custom details that make every property unique. From grand entryways and open-concept kitchens to backyard retreats built for entertaining, Graystone homes are crafted for those who value quality and comfort. Beyond your doorstep, you’ll find friendly neighbors, quiet cul-de-sacs, and the top rated Bixby School District, all just minutes from shopping, dining, and the conveniences of south Tulsa. Whether you’re raising a family, settling into your dream home, or simply looking for a place that feels like home the moment you arrive, Graystone is where it all comes together.
32,433 people live in Graystone, where the median age is 36.1 and the average individual income is $44,999. Data provided by the U.S. Census Bureau.
Total Population
Median Age
Population Density
Average individual Income
There's plenty to do around Graystone, including shopping, dining, nightlife, parks, and more. Data provided by Walk Score and Yelp.
Explore popular things to do in the area, including Crowe's Nest Salon.
Graystone has 11,725 households, with an average household size of 2.76. Data provided by the U.S. Census Bureau. Here’s what the people living in Graystone do for work — and how long it takes them to get there. Data provided by the U.S. Census Bureau. 32,433 people call Graystone home. The population density is 436 and the largest age group is Data provided by the U.S. Census Bureau.
Total Population
Population Density Population Density This is the number of people per square mile in a neighborhood.
Median Age
Men vs Women
Population by Age Group
0-9 Years
10-17 Years
18-24 Years
25-64 Years
65-74 Years
75+ Years
Education Level
Total Households
Average Household Size
Average individual Income
Households with Children
With Children:
Without Children:
Blue vs White Collar Workers
Blue Collar:
White Collar:
EXPLORE OTHER NEIGHBORHOODS
321 S Boston Ave Tulsa OK 74103
321 S Boston Ave Tulsa OK 74103